Run in Eclipse IDE
- JetBrains Runtime
- Enabling Hotswap Using the Vaadin Plugin
- Enabling Hotswap Manually
- Verifying the Setup
You can run and debug your Vaadin application in Eclipse IDE as you would any other Java application. Open the main Application class. Then click the Debug button in the toolbar indicated by a red circle in this screenshot:
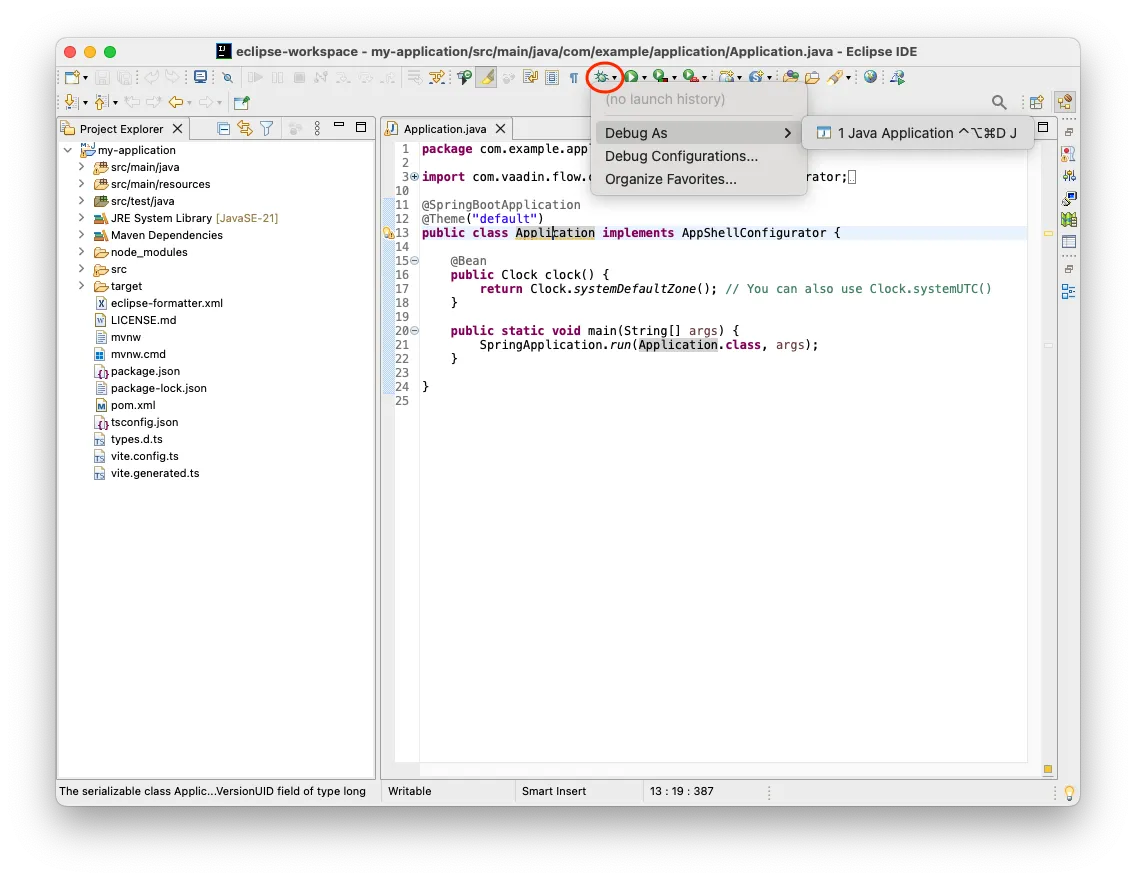
Now click . The application starts up and you can access it at http://localhost:8080. Hot deploy of the frontend files is enabled automatically. However, to enable Java hotswap, you have to take some additional actions.
JetBrains Runtime
Whichever way you enable hotswap, the application has to run on JetBrains Runtime, because hotswap of Java classes needs the enhanced class redefinition that it provides. Use JetBrains Runtime to execute your application, not necessarily your IDE.
If you use the Vaadin plugin, you don’t have to install it yourself: the plugin offers to download a JetBrains Runtime when it can’t find one, as described in the next section. For the manual setup, download the latest version from the JetBrains GitHub release page. Be sure to select the correct architecture.
Enabling Hotswap Using the Vaadin Plugin
The easiest way of running a Vaadin application with hotswap in Eclipse IDE is by installing the Vaadin plugin from the Eclipse Marketplace. If you haven’t done so already, do it now. Use the Eclipse IDE for Enterprise Java and Web Developers package. The same plugin also integrates Eclipse IDE with Vaadin Copilot, so that changes you make in the browser are written to your sources through the IDE.
The plugin bundles HotswapAgent and installs it for you as .vaadin/eclipse-plugin/hotswap-agent.jar in your home directory, and it takes care of JetBrains Runtime as well, so there’s nothing else to install.
To start the application, right-click the main Application class in the project navigator and click . If you can’t see this option, the Vaadin plugin has not been installed correctly.
When you start the launch, the plugin looks through the JREs that Eclipse IDE knows about for a JetBrains Runtime that matches the Java version your project requires. If it doesn’t find one, it opens a JetBrains Runtime Required dialog:
- Download JetBrains Runtime
-
Fetches the latest release for your operating system and processor architecture. The download is a few hundred megabytes, so it runs in a progress dialog that you can cancel. The runtime is installed as
.vaadin/jdkin your home directory, the same location that the Vaadin plugins for IntelliJ IDEA and Visual Studio Code use, so it’s downloaded only once per machine. It’s also added to the page, so that later launches reuse it. Should the newest JetBrains Runtime be older than your project requires, the plugin tells you instead of starting without it. - Continue Without JBR
-
Starts the application on a regular JVM. Only changes to method bodies are hotswapped then; adding or removing methods and fields still requires a restart.
To use a JetBrains Runtime that you installed yourself, add it on the page in (Windows) or (Mac) before you start the launch. The plugin then uses that one and doesn’t download anything.
The plugin creates a debug configuration named Application [Hotswap] that runs the application on JetBrains Runtime, starts the bundled HotswapAgent with a -javaagent parameter, and adds the other JVM parameters that hotswap needs. Because the agent comes from the plugin, you don’t have to install it into JetBrains Runtime, and the parameters listed in Debug Configuration are needed only for the manual setup. You can reuse the configuration later from the Debug button in the toolbar.
Once the application is running, continue with Verifying the Setup. You don’t need the manual steps described next.
Enabling Hotswap Manually
If you prefer not to install the Vaadin plugin, you can set up hotswap by hand. This consists of three steps:
-
Download and install JetBrains Runtime, as described above;
-
Download HotswapAgent and install it into JetBrains Runtime; and
-
Create a debug configuration for Eclipse IDE that runs the application with JetBrains Runtime and the
-XX:+AllowEnhancedClassRedefinition,-XX:+ClassUnloading, and-XX:HotswapAgent=fatjarJVM parameters, as described in Debug Configuration.
HotswapAgent
You can download HotswapAgent from the HotswapAgent GitHub release page. You’ll need version 1.4.2 or later.
Download the JAR file and place it inside the JetBrains Runtime installation directory as lib/hotswap/hotswap-agent.jar. You’ll need to create the hotswap folder, and rename the downloaded file to hotswap-agent.jar.
If you want to know more about the features of HotswapAgent, the documentation in the HotswapAgent webpage is a good resource.
Debug Configuration
Select , indicated by a red rectangle on this screenshot:
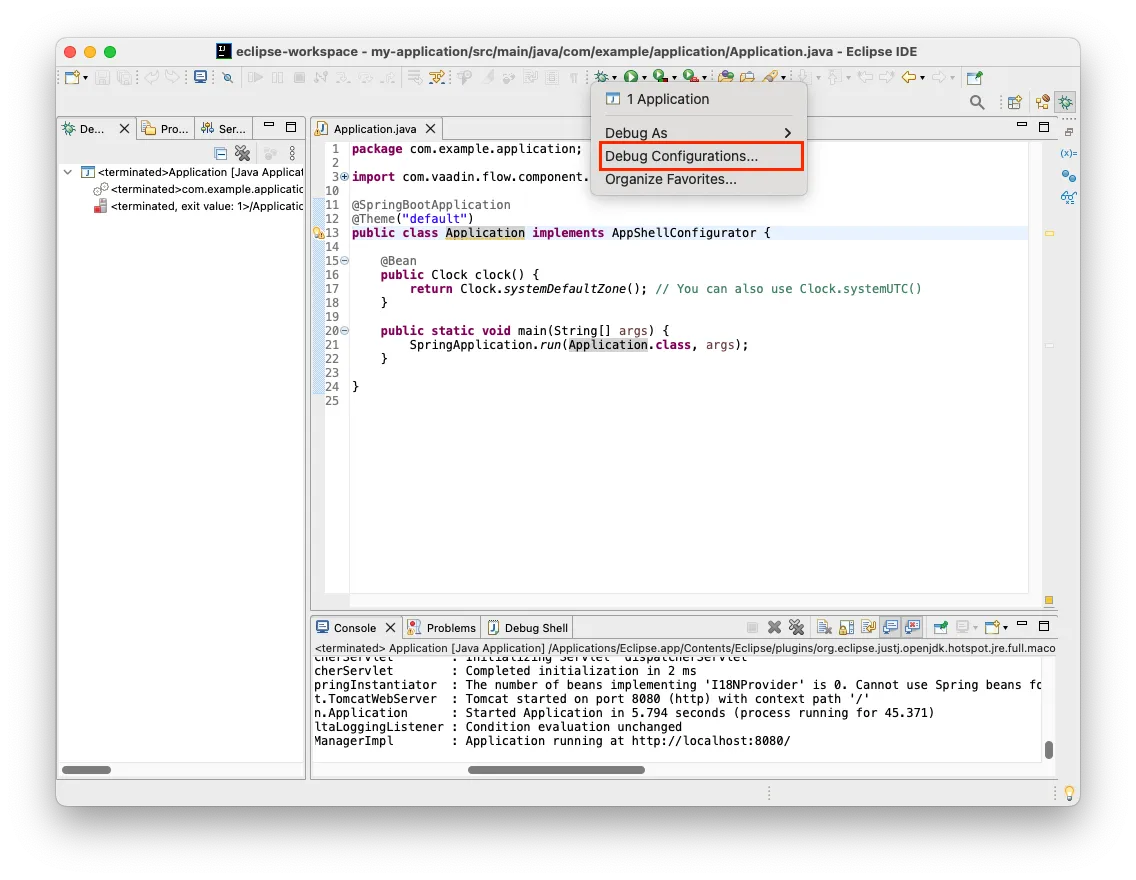
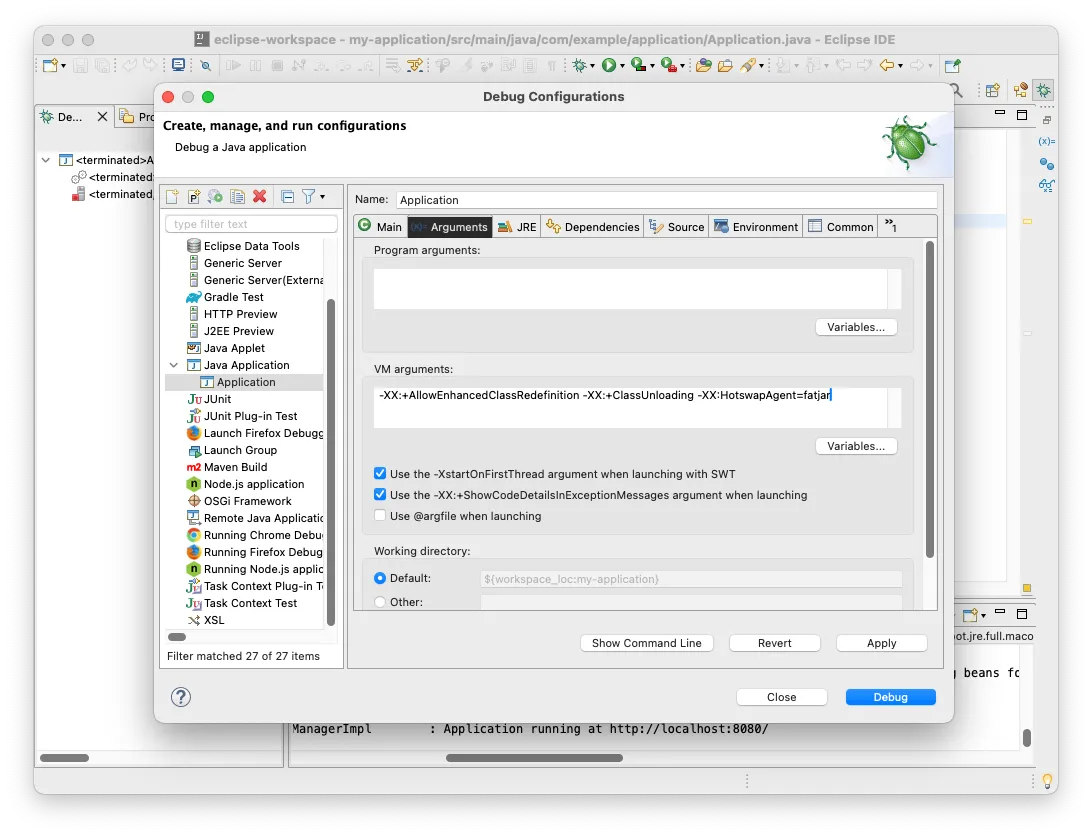
In the Debug Configurations window, select the Application configuration. Go to the Arguments tab. In the VM arguments field, copy-paste the following:
Source code
-XX:+AllowEnhancedClassRedefinition -XX:+ClassUnloading -XX:HotswapAgent=fatjarThese parameters do the following:
-XX:+AllowEnhancedClassRedefinition-
Enables the enhanced class redefinition of JetBrains Runtime. This is what allows changes such as added or removed methods and fields to be hotswapped; a standard JVM can only redefine method bodies.
-XX:+ClassUnloading-
Keeps class unloading enabled, so that classes the JVM no longer needs after a redefinition can be garbage collected. This is the default setting of the JVM; it’s passed explicitly to be sure that it isn’t turned off elsewhere.
-XX:HotswapAgent=fatjar-
Starts the HotswapAgent that you installed as
lib/hotswap/hotswap-agent.jar, including the plugins bundled with it.
These are JVM parameters, so they belong in the VM arguments field — not in the Program arguments field.
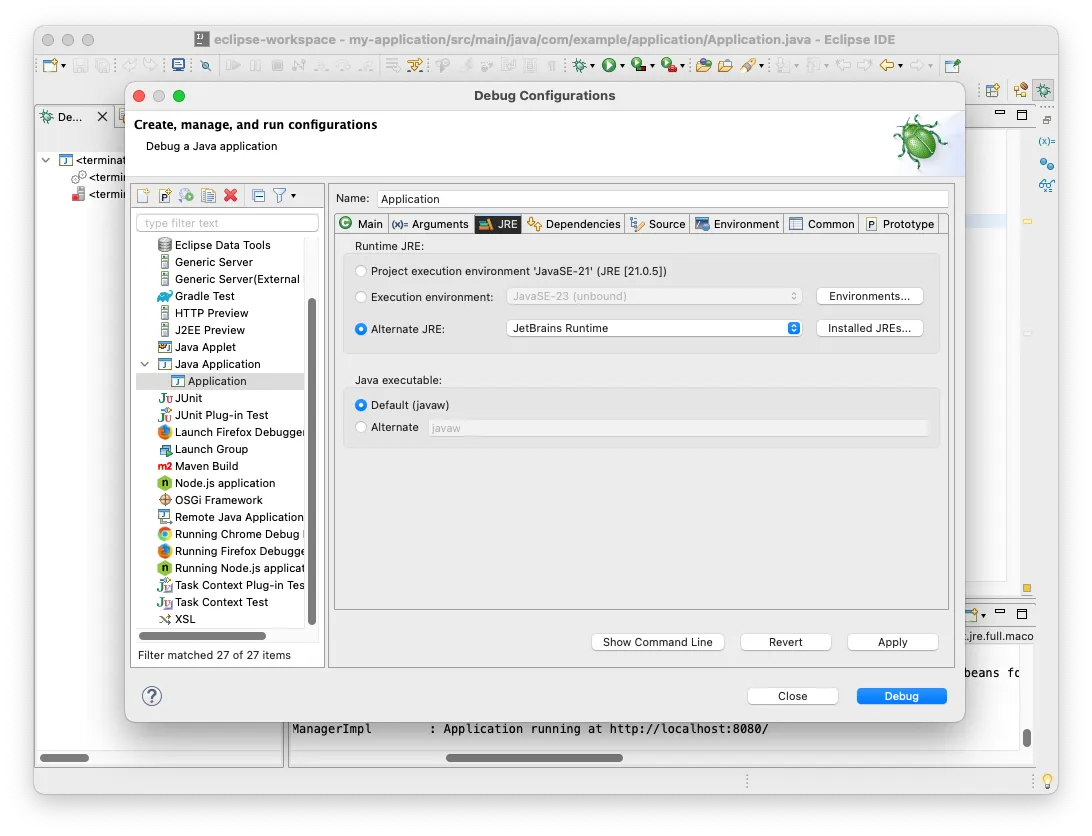
Next, go to the JRE tab. From the Alternate JRE select box, select JetBrains Runtime. If you can’t find it in the list, click Installed JREs and add it manually.
Click Apply, then start the application by clicking Debug. The application starts up.
Verifying the Setup
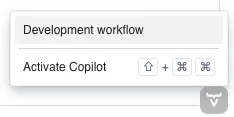
Open the application in a browser and verify that everything is working through Vaadin Copilot. Move your mouse pointer over the Copilot button at the bottom-right corner:
|
Important
| The Copilot button is only available when the application is running in development mode. It is not available in production mode. |
Now click Development workflow. Copilot reports the state of the Eclipse IDE integration and of Java hotswap. Both should be green when the Vaadin plugin is installed and the application was started with hotswap enabled. If the Eclipse IDE item is orange, the plugin is either not installed or not running; if the hotswap item is orange, the application isn’t running on JetBrains Runtime with HotswapAgent.